

Surprising Plastic Pollution Statistics & Facts of 2022
Article written by Guillaume Bonastre and Valentina Lopez
Recent years have seen a growing movement from cities, states, and even entire countries to either limit or ban the amount of plastic. With a focus on “single-use” items like plastic bags, the globe is finally beginning to reduce its plastic use after more than a half-century of growth.
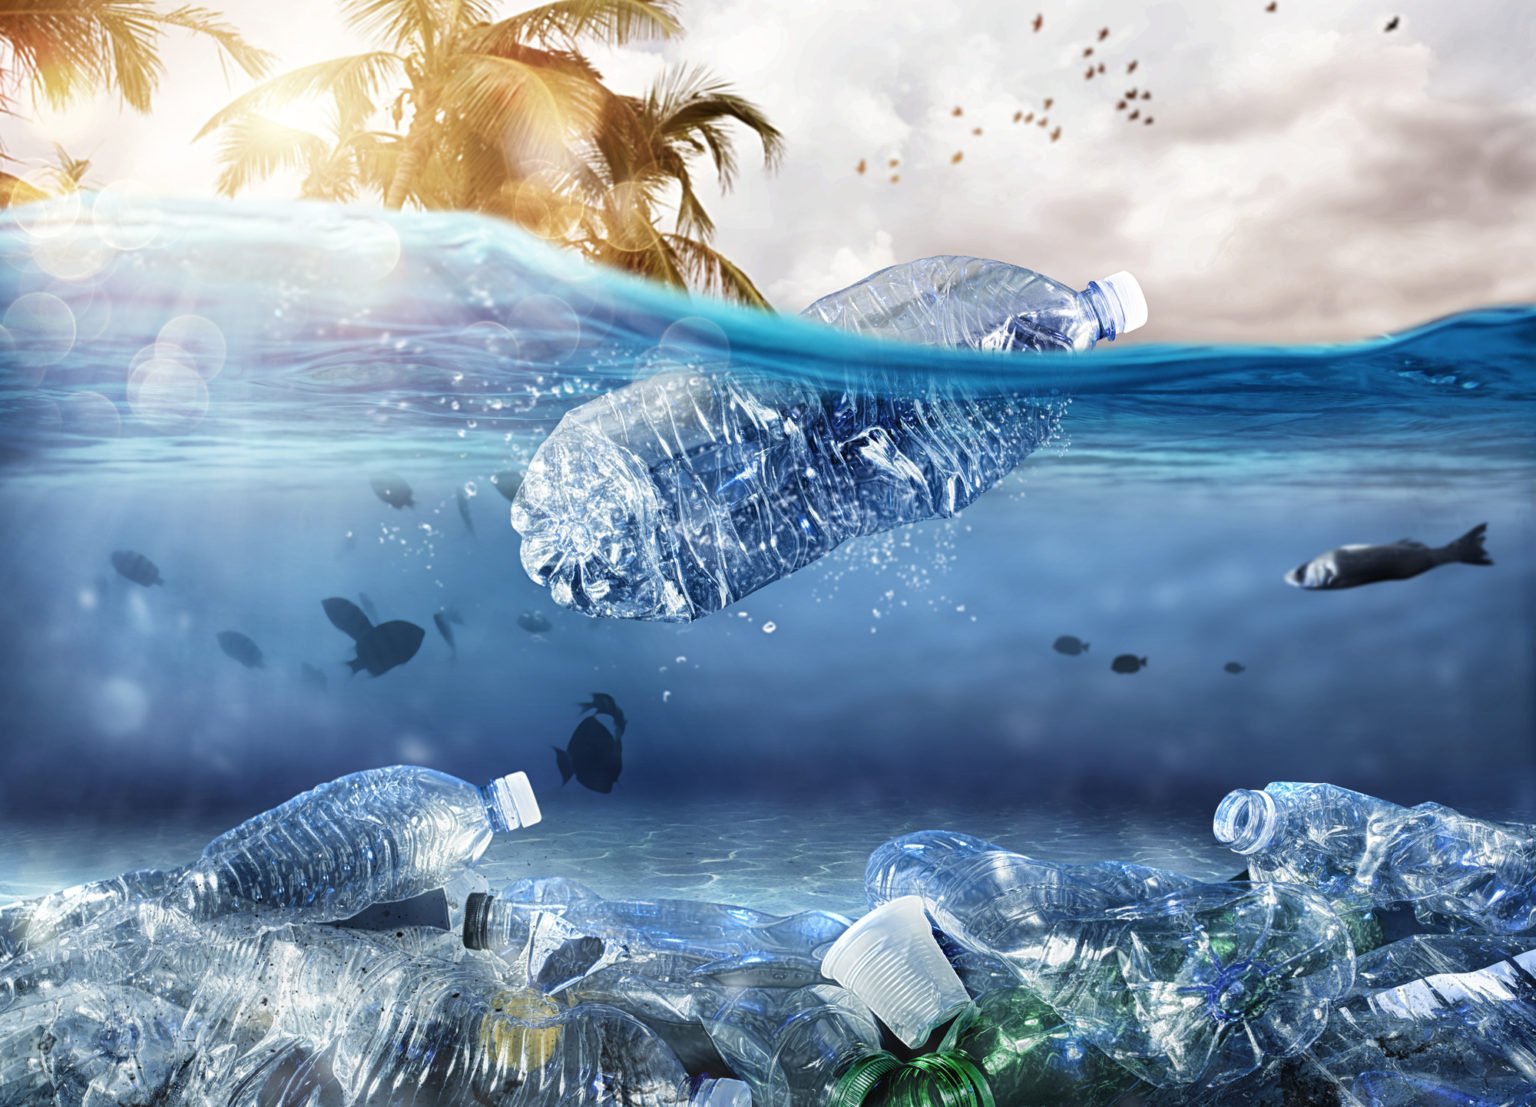
But what’s the result of our liberal plastic consumption? Slow to break down, microparticles of plastic float in the ocean, enter our food web, and kill millions of wild animals every year.
In this article, we’ll take a look at some of the most important plastic pollution statistics. While we will look at this industry and plastic production as a whole, we’ll focus mainly on how these plastic particles relate to marine environments and ocean pollution statistics.
How Much Plastic Is In The Ocean?
Much of the plastic in the ocean today comes from land-based sources.
Approximately two-thirds of the ocean plastic arrived from garbage left on the beach, flowing out of sinks or drains, or being swept by a river into an estuary. Poorly managed landfills located near the ocean, and even items flushed down the toilet are major culprits.
Because of this, a lot of plastic can be concentrated just offshore which is vital habitat for a large number of ocean species.
But plastic doesn’t stay in one place. It gets picked up on ocean currents and spread across the globe. It’s common for beach walkers to find discarded flotsam from the other side of the ocean washed up on their beaches.
Much of the plastic gets pushed along the currents and eventually concentrated in what we call gyres. Today there are five major gyres, the largest of which being the Great Pacific Garbage Patch (GPGP) which we’ll discuss in more detail below.
The final 33% of plastic in the ocean has been dropped from boats. The majority comes from fishing boats or containers falling overboard.
While we imagine that most of these plastic pieces as large pieces or at least big enough to be seen by the naked eye, a lot of the ocean plastic is microscopic. There are approximately 51 trillion microscopic pieces in the ocean weighing 269,000 tons. That’s as much as 1,345 blue whales.
Even with the massive expanse of the world’s oceans, this still adds up to a shocking density of plastic. On average, there are 46,000 pieces of plastic per square mile. Sailors report the most common man-made object they see on the ocean is floating plastic bags.
Getting rid of plastic bags, the primary culprit, isn’t always easy. Limiting their usage helps, but the sheer quantity of them makes it daunting. About one million plastic bags are used around the world every minute.
What about recycling them? It is possible, but it’s expensive. It costs approximately $150 U.S dollars to recycle a single ton. On average the recycled product can only be sold for about $32 on the open market.
What makes plastic so useful is also what makes it so harmful to the environment. Plastic is strong and flexible, making it a cheap and ideal solution for many day-to-day issues. There’s a reason so many of the kayaks we’ve reviewed here are made of polyethylene plastic.
But it also breaks down at a very slow rate. For example, a plastic water bottle can take up to 450 years to completely break down. As it deteriorates, the pieces get smaller and smaller until they turn into one of the countless microscopic pieces. While not as aesthetically ugly, these tiny pieces then enter the food web by being consumed by plankton and traveling up the food chain.
How Much Plastic Do We Produce Each Year?
Plastic production is still a big industry despite the rollbacks in recent years. Over 320 trillion tons of plastic were produced in 2016 and the number continues to grow. Recent estimates predict that number to double by the year 2034.
Today plastic plays a key role in almost every field of production. It’s easy to look at the big scapegoats such as plastic bags or water bottles, but plastic is a vital component in most products.
In the medical industry, it’s part of life-saving equipment for diabetics that require disposable syringes every day. It’s used for hip replacements and other physical ailments, particularly for those with arthritis. Plastic provides protection for construction workers with new, lightweight helmets.
Computers, phones, even cars rely on plastic as a key component. The difference is that in many cases, these “essential” products are meant to be used a long time if not indefinitely. Contrast this with a plastic bag or water bottle that may be used for an hour but can then persist in the ocean for centuries if not disposed of properly.
Plastic Pollution In The U.S

Plastic trash is scooped up out of the mouth of the Los Angeles River in Long Beach, California. (Bill McDonald/Algalita Foundation)
In general, higher-income countries consume more plastic products per person than more impoverished regions. The U.S is near the top of this list. The average American uses about 0.34 kilograms of plastic every day. This is almost triple the amount used by the other North American countries Canada and Mexico that use just 0.09 kg/person each day.
This makes the U.S the second-highest consumer of plastic on earth, using 37.83 million tons each year. It is a distant second to China however which uses almost 60 million tons annually.
But this doesn’t necessarily make the U.S one of the world’s largest plastic polluters. While high-income countries tend to use more plastic per capita, they also have the financial means to better dispose of it.
Today the U.S and similar high-income countries dispose of the majority of their plastic in secure and well-managed landfills or recycle it despite the low financial value. By comparison, lower-income countries that don’t consume as much plastic often have uncontrolled landfills or no waste management system at all, making it easier for waste to find its way to the ocean.
The Philippines and Sri Lanka for example see more than 80% of their waste disposed of in poorly regulated landfills or unceremoniously dumped somewhere, making it much easier for plastic particles to find their way to the ocean.
Impact On Wildlife & Fish
About two-thirds of the world’s fishing grounds are being negatively affected by plastic ingestion.
Seabirds are the most common victims of plastic consumption.
This can occur in a number of ways. Shiny pieces of plastic may look similar to a bird’s food source and accidentally consumed. The plastic then becomes lodged in the digestive system and starves the bird. Their prey can also accidentally consume plastic which then radiates up the food chain with deleterious effects.
Sea turtles are also frequent victims of plastic impersonating their preferred food sources. Many turtles that spend large periods of their time riding the ocean currents eat jellyfish. A floating plastic bag near the surface looks almost identical to a jellyfish making them easy to mistake.
In one study, many larger, charismatic marine animals were examined for signs of plastic pollution including sea turtles, seabirds, and marine mammals.
Every sea turtle studied was found to have ingested at least some trace of plastic. 40% of sea birds were found to contain some degree of plastic contamination as were three in five marine mammals. Seals were found to have a lower percentage, about 33%, although that is still a shockingly high number.
This poisoning is having serious impacts on these animals’ life expectancy. When coupled with other threats to their ecosystem such as climate change, overfishing, and habitat degradation, many of these populations are at risk. Plastic alone is responsible for the death of 100,000 sea turtles and marine mammals every year along with more than a million seabirds.
Today scientists have designated more than 200 “dead zones” in our oceans where no marine life is capable of surviving due to pollution and habitat degradation.
Bottled Water In Rich Countries
There is a water crisis that is currently stretching around the globe. More than a billion people don’t have access to clean, reliable tap water. Yet many of the countries that do have access to clean tap water are the biggest consumers of bottled water.
In America alone, 15 billion gallons of bottled water are consumed every year. But this isn’t a zero-sum game. Resources must be invested to create plastic bottles and transport them across the country. On average, it takes 36 ounces of water to make a single 12-ounce bottle of water.
Despite new action to promote the recycling of these single-use bottles, 22 billion bottles still find their way into landfills each year, where they begin their slow degradation process.
And yet studies have shown that 40% of bottled water originates from a tap and has no additional value when compared to water from your sink. In addition, 17 billion barrels of oil are required in order to create the bottles.
Many of these discarded bottles find their way onto beaches across the world. In the UK alone, it’s estimated that there are about 150 plastic water bottles per mile on the beaches.
Great Pacific Garbage Patch

Great Pacific Garbage patch patterns.
Perhaps the most infamous symbol of the plastic crisis is the Great Pacific Garbage Patch. Located in the North Pacific, this massive gyre is approximately two times the size of Texas. In it is an amalgamation of the waste from the countries that border the Pacific Ocean, primarily North America and Japan.
The gyre stays in relatively the same place but behaves like a whirlpool moving in slow motion, slowly drawing in water and the plastic refuse floating on the Pacific currents. Throughout the gyre, data extracted from trawling has indicated that 99.9% of all the floating debris is plastic.
All told, the gyre is composed of 1.8 trillion individual pieces of plastic for a total weight of 79,000 tons.
A large amount of the trash in this patch originated from ocean-going ships or fishing boats. Because of this a large amount of the garbage here is nets, buoys, and containers that have fallen overboard. This is attributed to the growing amount of fishing pressure throughout the Pacific.
Beginning to clean the garbage patch is a daunting task that will require a huge financial commitment from countries across the globe. At our current rate of consumption, oceanographer Charles Moore predicts that the patch will double in size in the next ten years.
Even 67 ships working on removing the plastic waste for an entire year would remove less than 1% of it.
Conclusion
The plastic boom of the last 70-years has a legacy that will persist across the globe for centuries. Plastic has many benefits, some of which have saved lives. But the scourge of single-use plastic and poor landfill management has led to damage that now seriously affects the livelihoods of both man and animal across the globe.
While it is too late to reverse many of these figures, there are ways forward. At this juncture, prevention is better than a cure.
The best way to help is to limit your use of single-use products whenever possible. Actions like bringing your own bags to the grocery store and purchasing your own multi-use water bottle are small steps.
More important is supporting wider-ranging political initiatives such as plastic bag bans and ensuring high-quality water available to more people. Even if these programs mean a little more inconvenience or cost for you, the effect can be much more positive and wide-ranging than simple individual actions.
Interested in learning more about ocean and water issues and connecting with advocates?
Check out Blue Innovation! The 5th Annual Blue Innovation has been expanded to a 3-day event in September. A large delegation from Biarritz, France (Santa Cruz’s Sister City) will join us for a series of exhibitions, workshops, and a competition. Over 3,000 attendees will join this outdoor event at the beautiful Seymour Marine Discovery Center (see Google Earth). Food trucks, bands, and speakers will regale us.